
View Chapter:
Downloads:
Chapter 8
Appendix B: Data
The Dataset of World Refugee and Asylum Policies (DWRAP) is a novel dataset that compiles all national laws relevant to forcibly displaced populations across a sample of 205 countries from 1951 to 2022. It includes a total of 951 unique national-level migration laws. Specifically, the dataset captures de jure policies on asylum and forced migration, offering an objective measure by relying on legal texts rather than subjective interpretations of policy enforcement.
In developing DWRAP, countries were selected for inclusion based on the United Nations geoscheme. The dataset encompasses all nations within the following regions: Eastern Africa, Middle Africa, Northern Africa, Southern Africa, Western Africa, Western Asia, Central Asia, and Southern Asia.
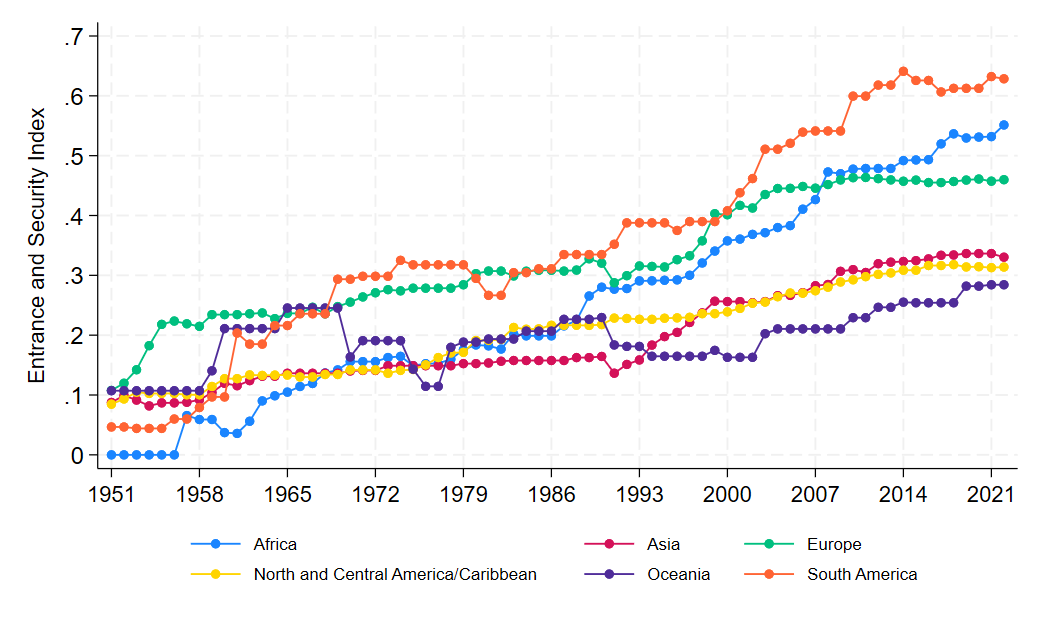
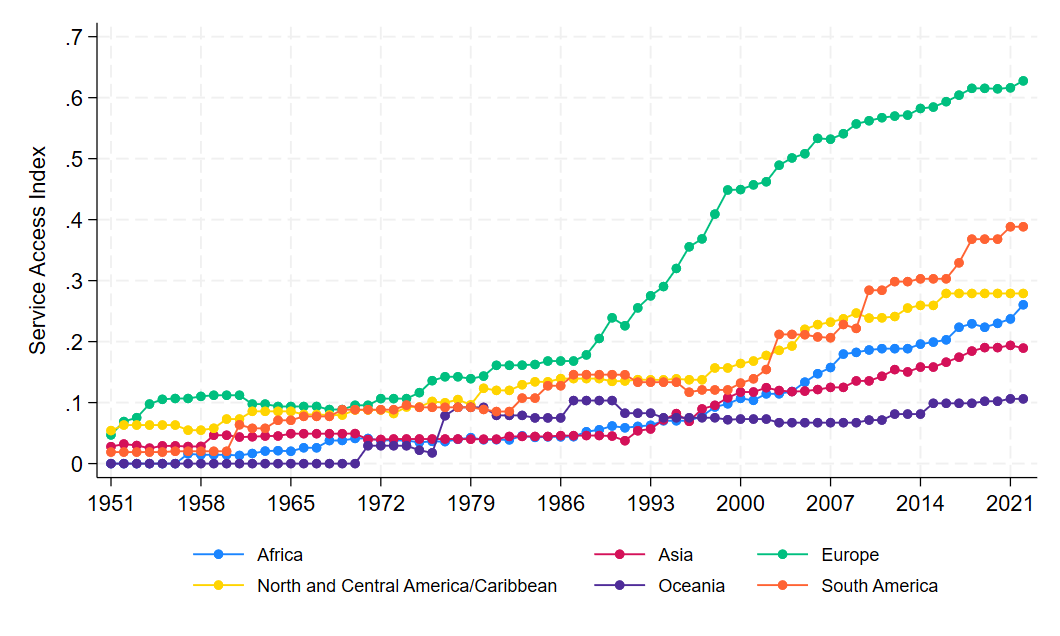
Refugee and asylum policies are conceptualised as a set of provisions regulating five core dimensions: (1) access, which reflects the ease of entry and security of legal status; (2) services, covering the provision of public services and welfare; (3) livelihoods, representing the ability to work and own property; (4) movement, addressing encampment policies; and (5) participation, which includes pathways to citizenship and political rights. For each law, DWRAP codes 54 provisions across these five dimensions.
Each of the 54 variables is measured on an ordinal scale, coded as discrete values from 0 to 3, where higher scores indicate more liberal policy measures. For instance, a score of 2 reflects a more liberal measure than 1, which in turn is more liberal than 0. To aggregate these provisions, Principal Component Indices are constructed, consolidating the data from individual policy provisions into 14 policy strands, from 14 strands into the five core dimensions, and finally, into an overall policy score. Each index is normalised to range from 0 to 1, facilitating comparisons of policy regimes across countries and over time. By constructing these indices, DWRAP provides a comprehensive and standardised tool for analysing refugee and asylum policies globally.
Figure B1: Access Index
Panel A: Index Evolution by Continent
Panel B: Average Index between 1951 to 2021
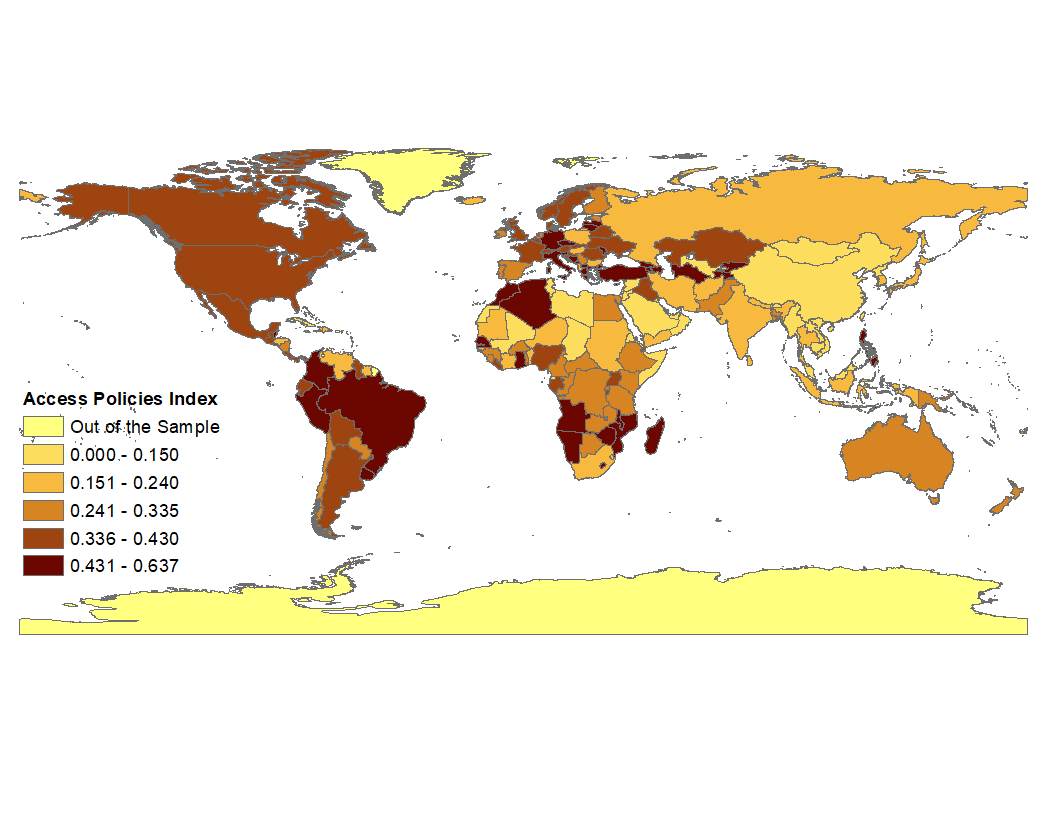
Figure B2: Service Access Index
Panel A: Index Evolution by Continent
Panel B: Average Index between 1951 to 2021
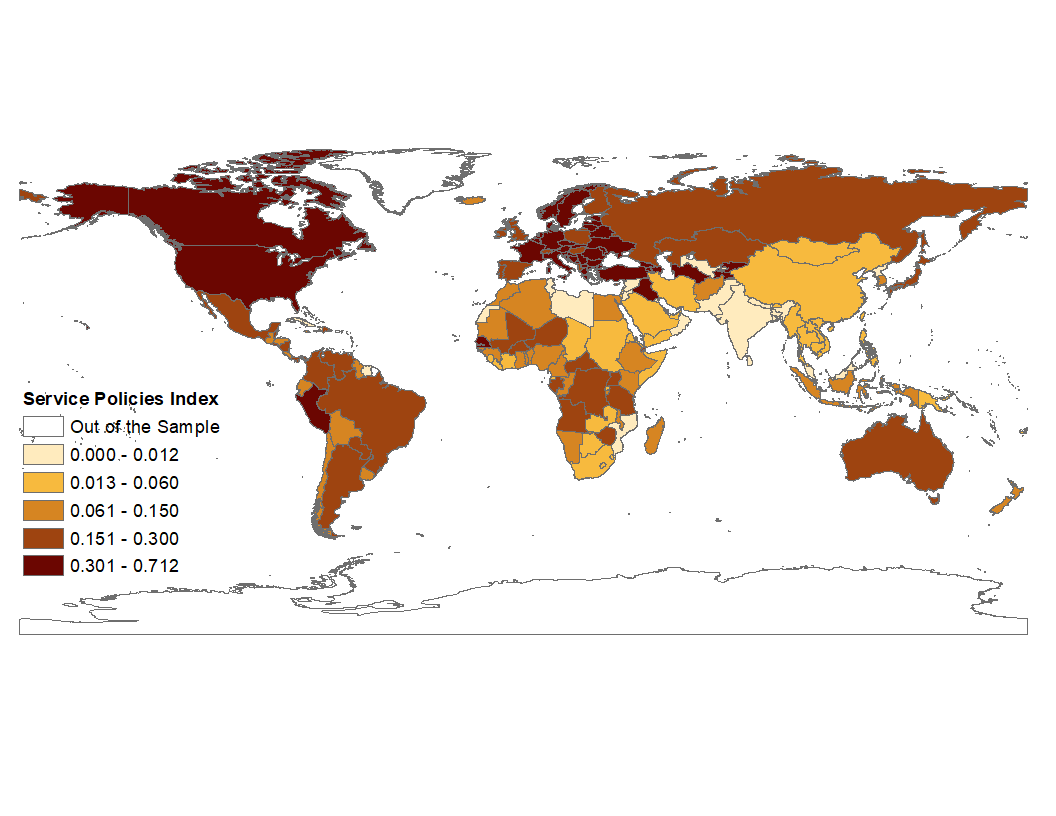
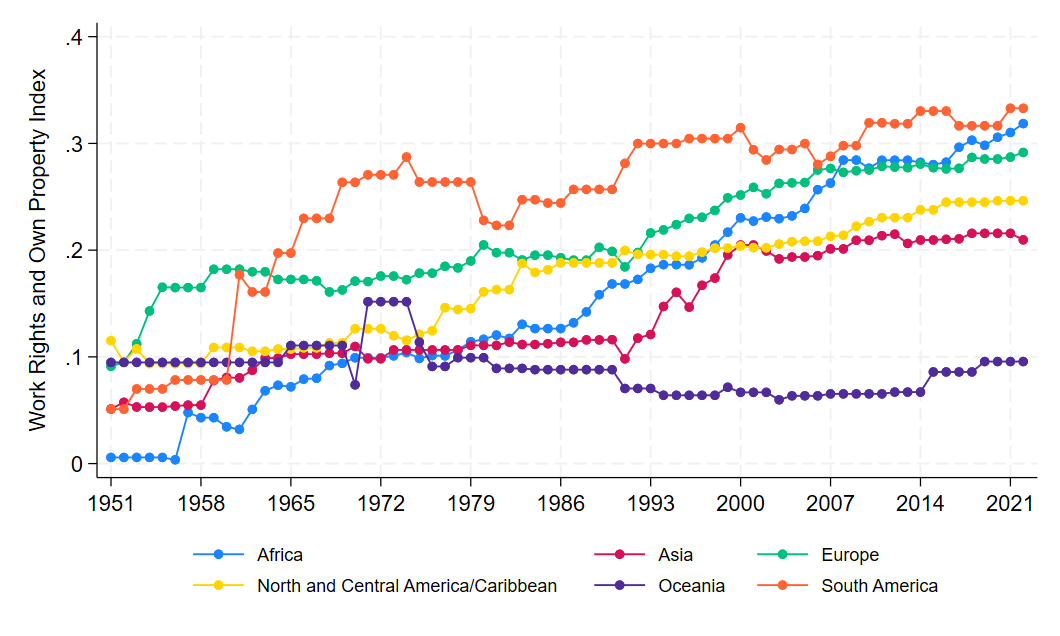
Figure B3: Livelihood Index
Panel A: Index Evolution by Continent
Panel B: Average Index between 1951 to 2021
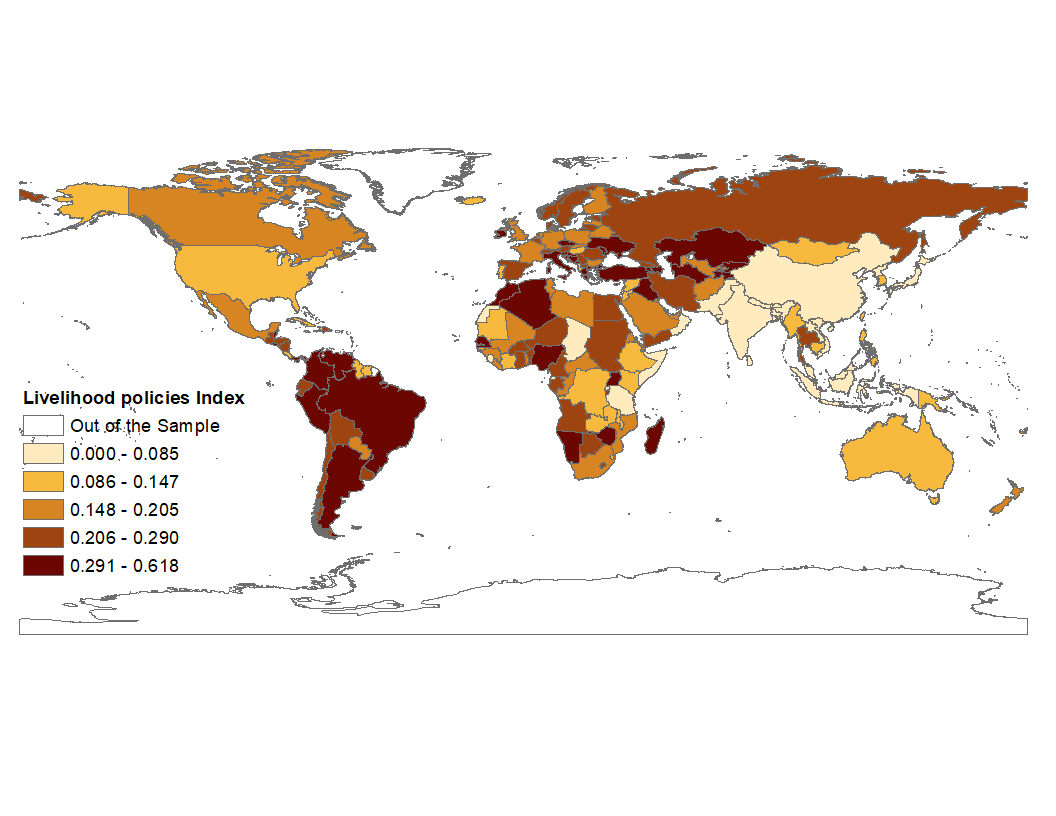
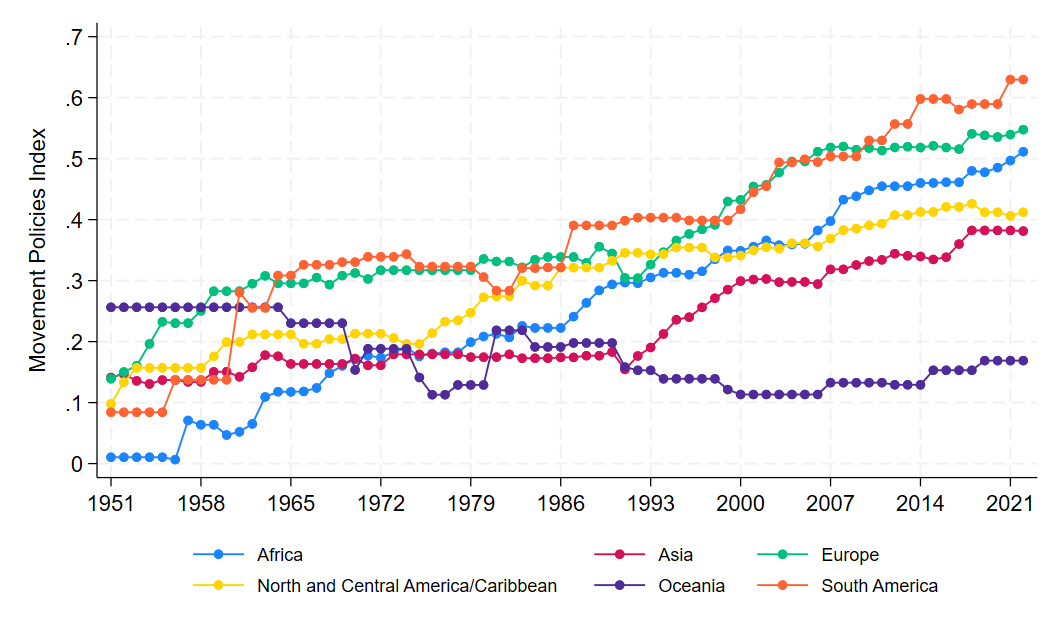
Figure B4: Movement Policies Index
Panel A: Index Evolution by Continent
Panel B: Average Index between 1951 to 2021
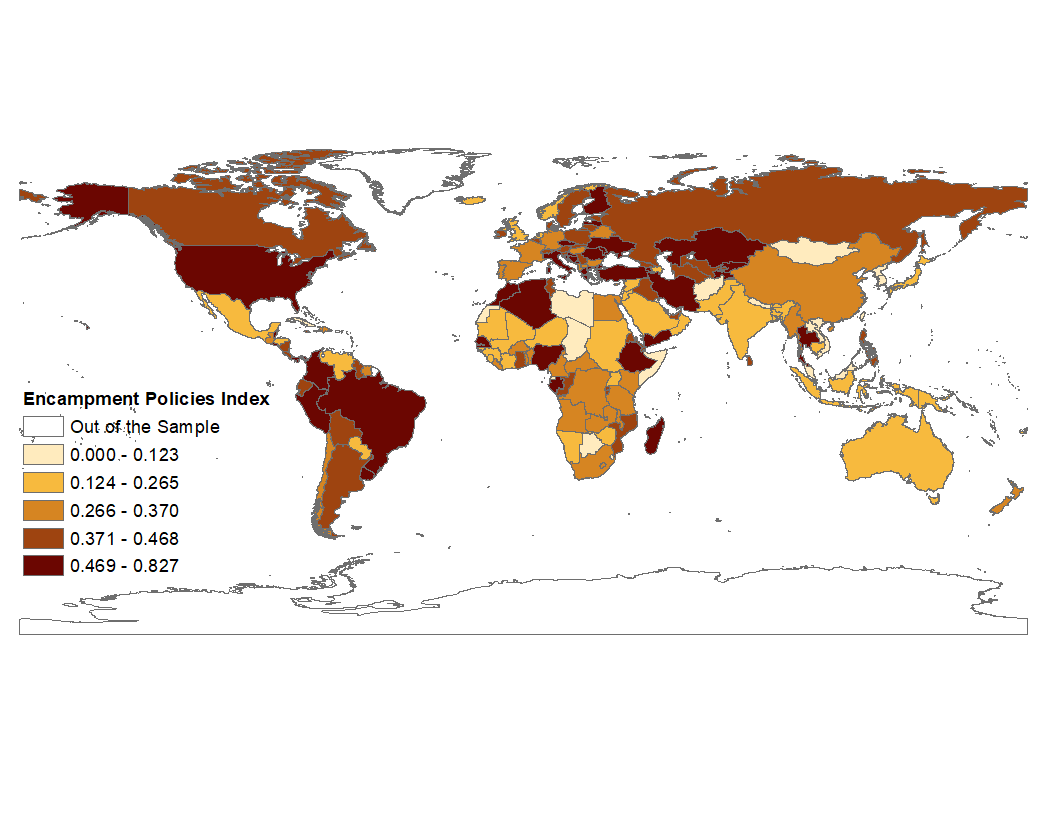
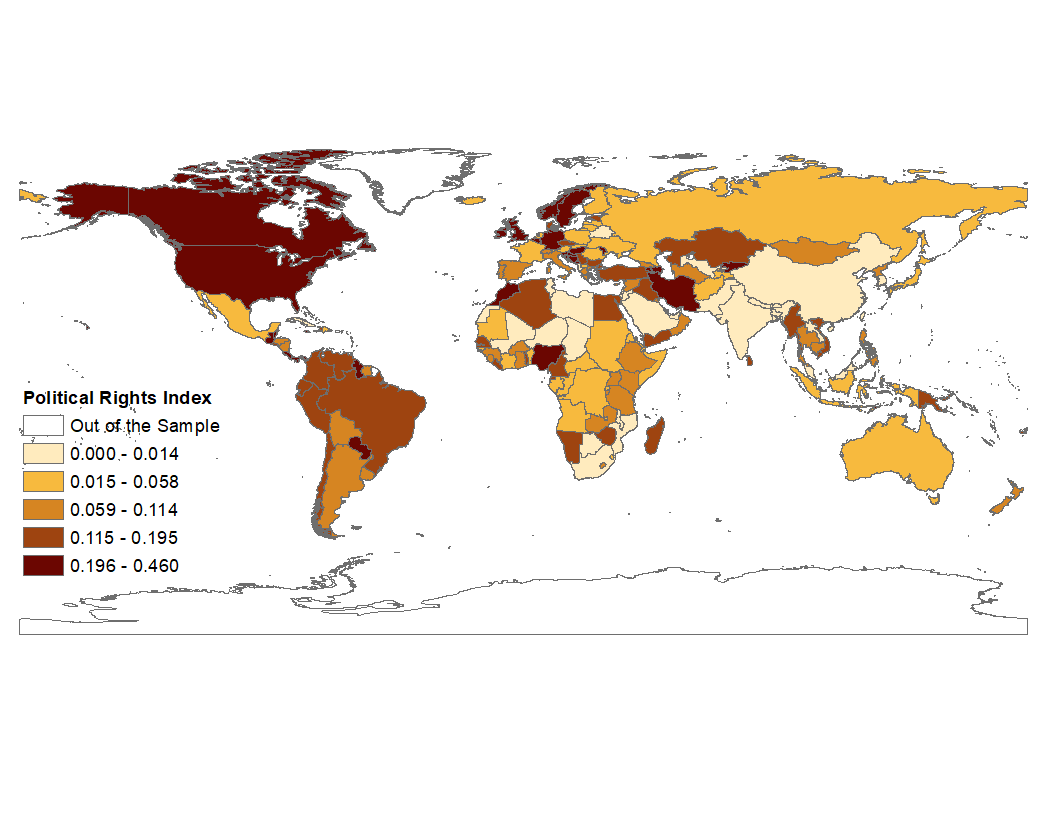
Figure B5: Political Rights Index
Panel A: Index Evolution by Continent
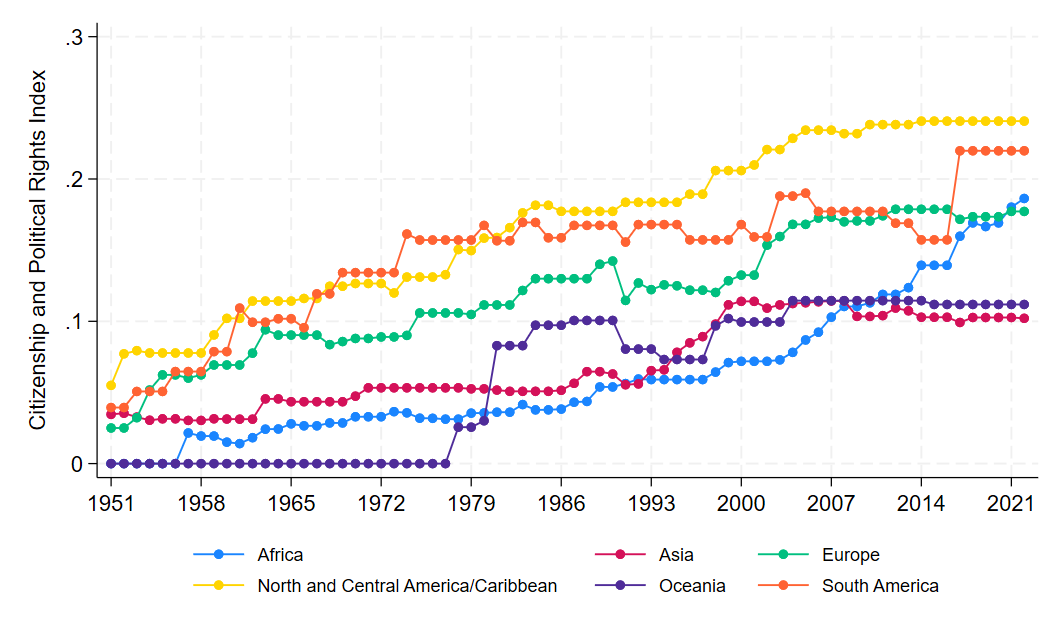
Panel B: Average Index between 1951 to 2021
Contact VoxDev
If you have questions, feedback, or would like more information about this article, please feel free to reach out to the VoxDev team. We’re here to help with any inquiries and to provide further insights on our research and content.